General Information
SKILLQUBE’s assessment software is used to display content that is not available on the original monitors. This includes measuring temperature and blood sugar, auscultation, and many other functions. To control and adjust these values, the software must be connected to SKILLQUBE’s qubeCONTROL. You can find instructions on how this works in the qubeCONTROL manual.
Please note that the software is always kept up to date to ensure safe and reliable use. You can view the currently installed software version to the right, below the software logo.
Using an Apple Device
Since the assessment software can run on various devices such as the iPhone, iPad, and
others, please visit the following link if you have questions about your device:
https://support.apple.com/en-us/docs
You can look up important functions that are used regularly at the following links:
Connecting to a Wi-Fi network:
https://support.apple.com/guide/ipad/connect-to-the-internet-ipad2db29c3a/ipados
Open Control Center on the iPad:
https://support.apple.com/en-us/111790
Get apps in the App Store
https://support.apple.com/guide/ipad/get-apps-ipad9b4cea76/ipados
Turning the iPad on/off:
https://support.apple.com/guide/ipad/turn-ipad-on-or-off-ipad63d30b5a/ipados
Software Overview
After you launch the software on your device, the layout of the icons may differ from the images shown below. This is normal and is because the software automatically adjusts to the size of your screen. The screenshots used here were taken on a 10.2-inch iPad to provide a better overview.
After installing and opening the software for the first time, you can tap “Sign in” in the upper-right corner and use the login credentials provided to you to log in to qubeCLOUD. This has the advantage that you can upload large media files (images or videos) to the assessment software in advance, so you no longer need to send them—you simply need to share them for viewing. After successfully logging in, your name or your organization’s name will be displayed.
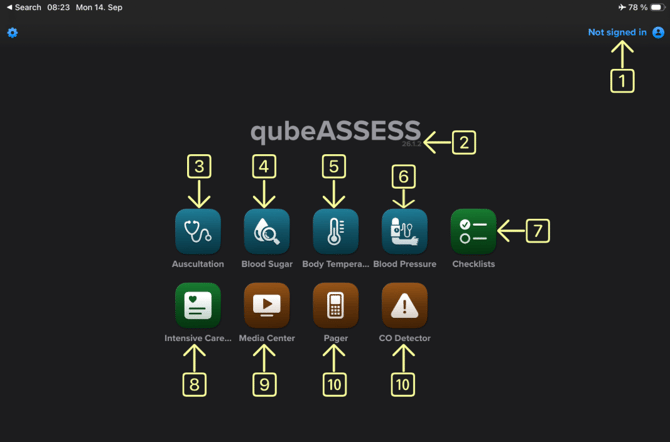
1. Login
2. Software version
3. Auscultation
4. Blood Sugar
5. Body Temperature
6. Blood Pressure
7. Checklists
8. Intensive Care Units
9. Media Center
10. Pager
11. CO Detector
To access the desired section, tap the corresponding field. Once it opens, you can exit the selected view by swiping down or tapping the down arrow at the bottom of the screen, which will return you to the main view, as shown in the image.
Auscultation
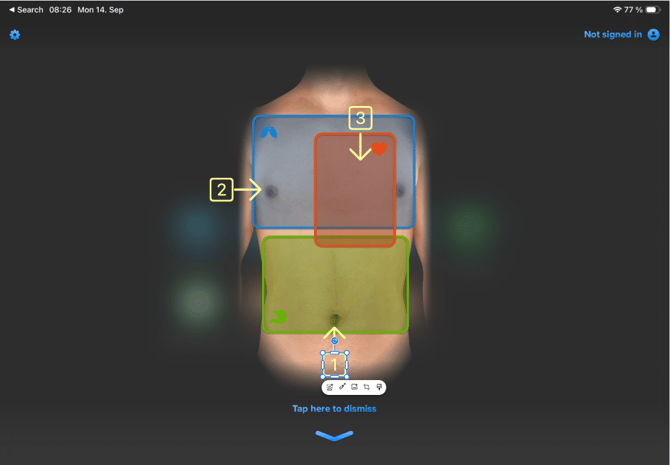
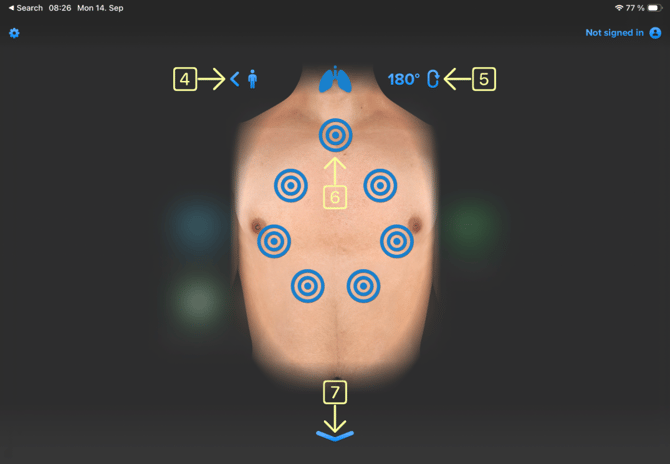
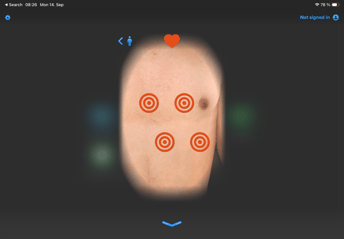
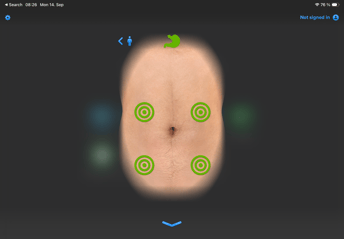
To open the app, tap the corresponding icon (3). Here you’ll find an overview of the available auscultation options. The blue area is for lung sounds, the green area for abdominal sounds, and the red area for heart sounds.
When you select an area, you’ll see an upper body with dots colored accordingly. These dots represent the auscultation area where the stethoscope head would be placed. Press and hold a dot to hear the sound set in qubeCONTROL. Use the arrow in the upper left corner to return to the auscultation overview, and use the lower arrow or a downward swipe gesture to close the auscultation app. During lung auscultation, you can rotate the torso 180°.
1. Auscultation Abdominal (green)
2. Auscultation Lung (blue)
3. Auscultation Heart (red)
4. Return to the auscultation overview
5. Rotate the upper body 180° (for the lungs only)
6. Auscultation point (tap to listen)
7. Return to the main view (or swipe)
Auscultation Heart Auscultation Abdominal
Blood Sugar
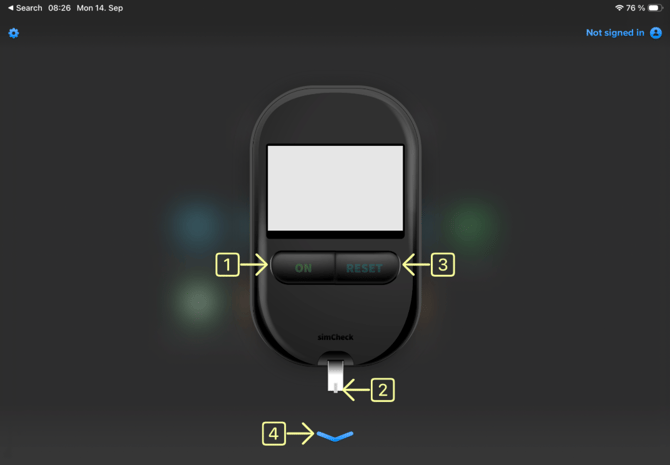
To switch to the blood glucose measurement screen, tap the corresponding icon (4). A screen displaying the blood glucose meter will open. This is not intended to replace the device used in real-world applications, but merely to simulate the time lag caused by the blood glucose measurement. To do this, the device must be virtually turned on, and blood must then be virtually applied. After a predefined delay, the blood glucose value set on the qubeCONTROL is displayed in mg/dL or mmol/L.
1. Turn the device on/off
2. Apply blood and wait for the measurement
3. Prepare the device for a new measurement
4. Close the screen (or swipe to close)
Body Temperature
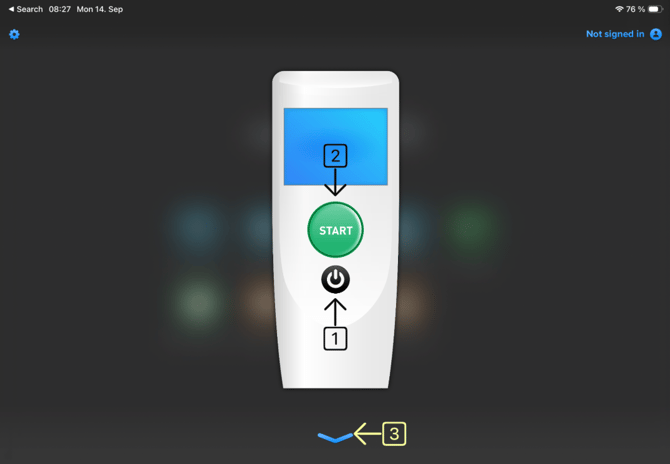
To switch to the temperature measurement screen, tap the corresponding icon (5). The screen with the temperature measuring device will open. This is not intended to replace the device used in real-world applications, but merely to simulate the time delay caused by the measurement. To do this, you must virtually turn on the device and then press “Start.” After a short delay, the temperature value set on the qubeCONTROL will be displayed in °C or °F.
1. Turn on/off
2. Start measurement
3. Close the screen (or swipe)
Blood Pressure
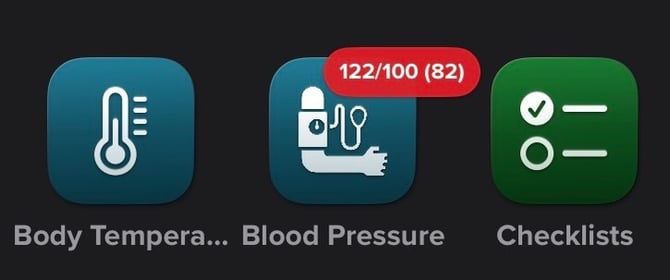
When you tap the blood pressure icon (6), no additional window opens. Instead, qubeCONTROL displays a message indicating that the user has just measured their blood pressure. If the user confirms this, the blood pressure reading is displayed accordingly.
This feature is designed to simulate the first “manual” blood pressure measurement so that it is used.
Checklists
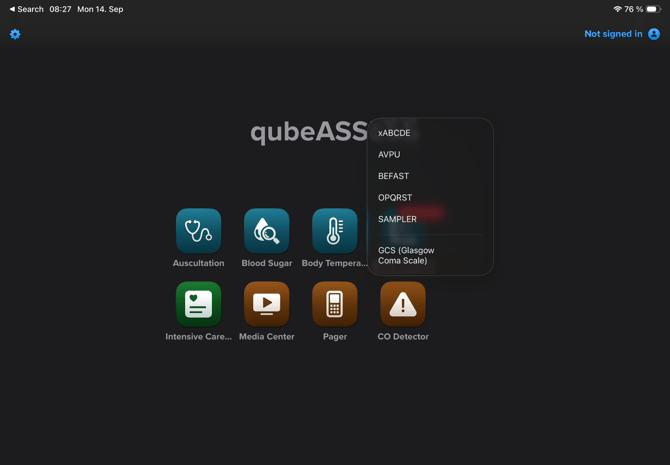
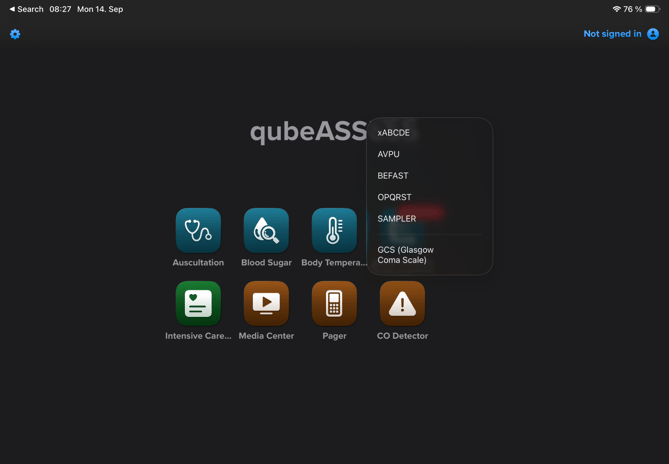
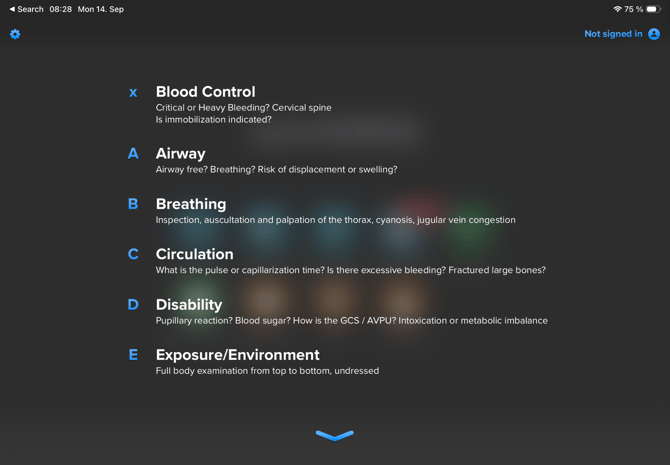
When you select “Checklists” (7), a small overview window opens where you can choose from various checklists to view. By default, these are organized according to the standard protocols used in emergency medical services. Additionally, you have the option, for example, to have the GCS score calculated for you.
Intensive Care Units
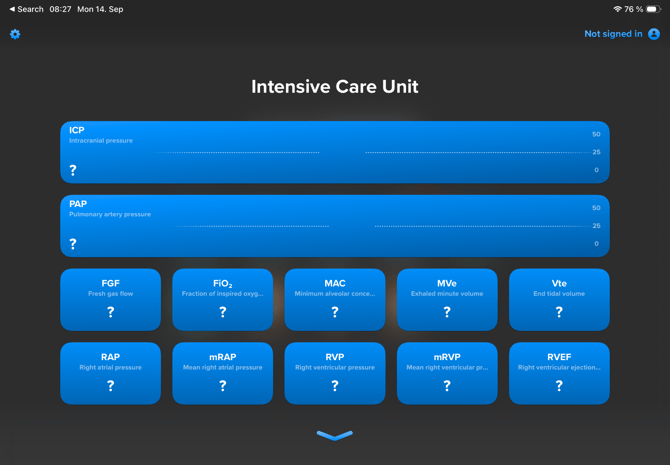
To switch to the intensive care values view, tap the corresponding icon (8). Here you’ll find two waveform views at the top. You can display the ICP, CVP, PAP, and BIS values here. If you want to switch waveforms, tap the current one and then select the waveform you want. Below these are all the numerical fields displaying values you would expect to see in an intensive care unit. You can enable or disable these and the waveforms on the qubeCONTROL and adjust the values accordingly.
Media Center
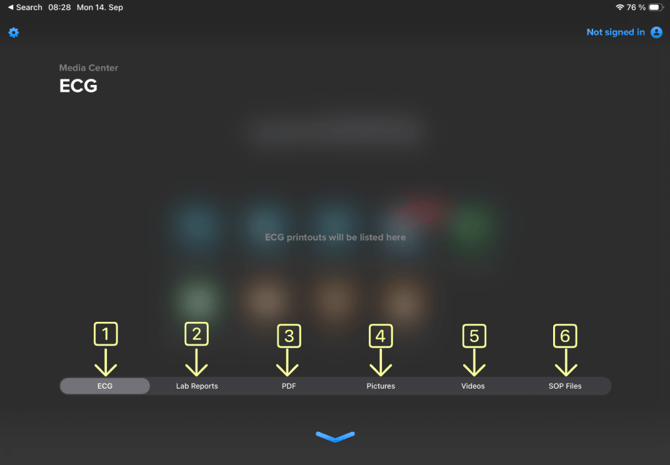
To switch to the Media Center view, tap the corresponding icon (9). Here, you can view all files relevant to your scenario. This includes all printed ECGs, lab reports, PDFs, images, and videos assigned to your scenario. When you send one of these file types from qubeCONTROL, it is indicated by a badge. This means that a small red dot appears here to indicate that new files are available. You can access the files again at any time. They remain available for debriefing even after a scenario has ended. They are only reset when a new scenario is started.
- ECG – All ECGs printed on the monitor are stored here.
- Lab Reports – Displays the lab reports created on qubeCONTROL
- PDF – Documents stored in the iPad’s media
- Images – Images or medication plans for realistic simulation
- Videos – Videos relevant to a scenario can be displayed here.
- Close the view (or swipe)
- SOP files stored on qubeCLOUD
Pager
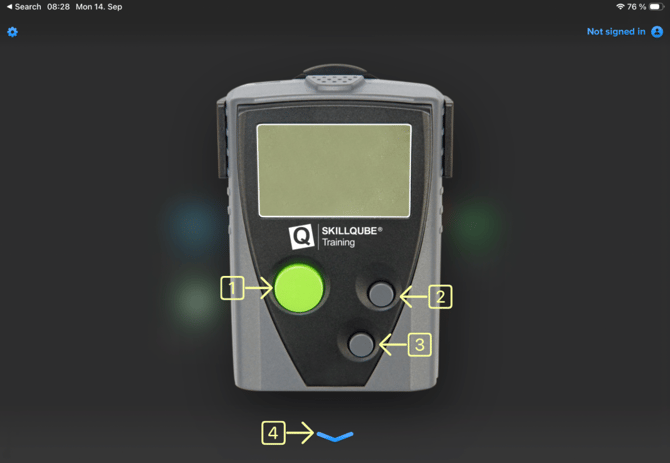
To switch to the pager view, tap the corresponding icon (10). This allows you to start the scenario in a realistic manner. Enter the desired emergency alert in qubeCONTROL and then send it to qubeASSESS. Once the message is received, the radio pager automatically opens and displays the message. Pressing “Confirm” (1) acknowledges the alarm. If you want to view the alarm message again, you can open it by pressing the icon once more. If more than one message is sent to the pager in a scenario, you can cycle through and view them using the control buttons (2, 3).
1. Confirm and Close
2. Previous message
3. Next message
4. Close the view (alternatively, swipe)
CO Detector
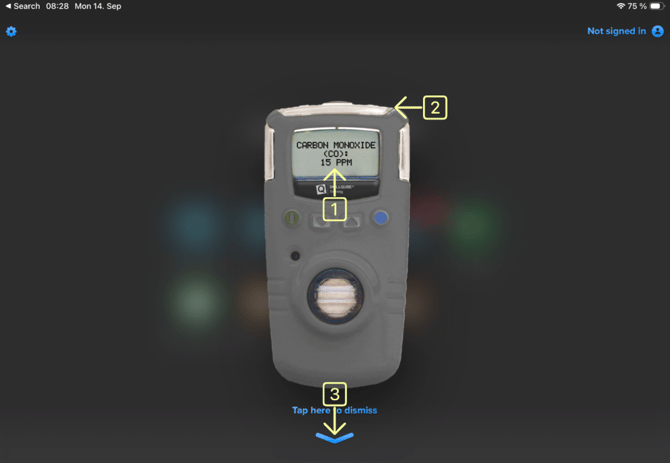
To switch to the CO detector view, press the corresponding icon (11). This allows you to simulate carbon monoxide incidents in the scenario and thus tailor a potential learning objective such as “Safety at the Incident Site” accordingly. Enter the desired value in qubeCONTROL and then send it to qubeASSESS. Once the value is received, the CO detector opens automatically and displays the corresponding value. Press Confirm (1) to acknowledge the alarm. The alarm levels are divided into 3 ranges.
Alarm 1 – 30 to 60 ppm
Alarm 2 – 60 to 150 ppm
Alarm 3 – > 150 ppm
Depending on the value, a different alarm tone sounds to indicate the danger.
1. Alarm display with value
2. Red warning indicator
3. Close the view (or swipe)
Checklists
The “Checklists” section provides pre-programmed or custom checklists. Checklists must be created in qubeCLOUD and synchronized.
Checklists can be disabled under “Miscellsneous Adjustments” -> “ExamMode”.
Previously Recorded Values
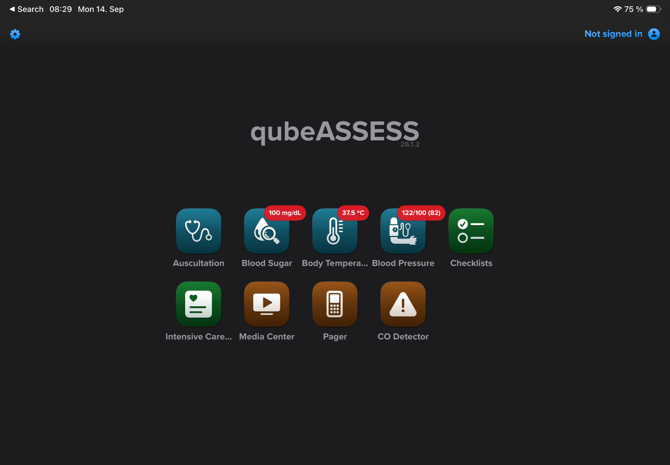
Measurements that have already been taken are displayed in qubeCONTROL as a batch, as shown in the following image. Here, you can find all the information from previous measurements or see that new files have been received in the Media Center.
Troubleshooting
|
Problem |
Possible cause |
Solution |
|
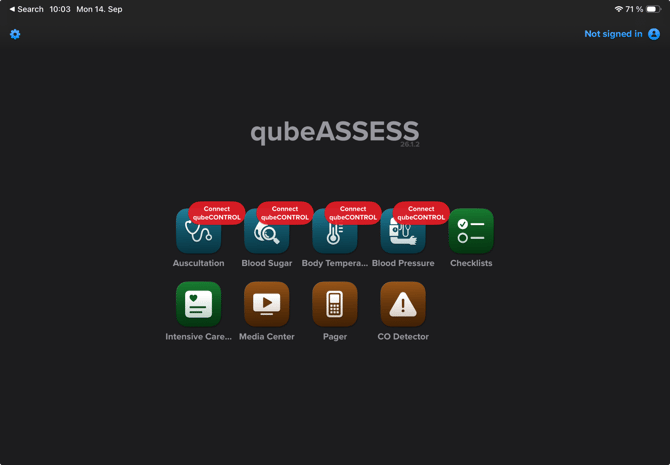
When you select a parameter, “Connect qubeCONTROL” is displayed. |
qubeCONTROL is not connected to qubeASSESS. |
Make sure all iPads are on the same Wi-Fi network, and connect the devices as usual using the Connection Center. |
|
|
||
|
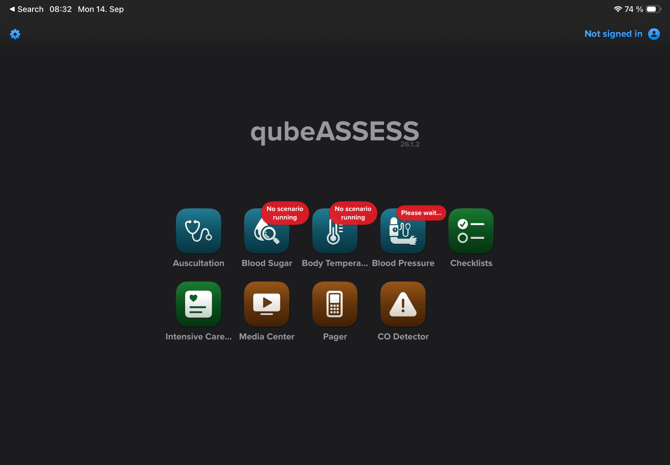
When selecting a parameter, “No scenario is running” is displayed. |
No scenario has been started yet. |
Start a scenario. The data from qubeCONTROL will now be transferred to qubeASSESS. |
|
|
||